Thursday, July 20, 2006
PL/SQL Debugger in Visual Studio Configuration
[Update March 2015: This very popular blog post is quite a bit out of date after 9 years! As one example, Oracle Database 12c now requires extra permissions (ACLs on specific IPs and port ranges) to perform PL/SQL debugging -- and in response we created the Grant Debugging Privileges Dialog as a one stop shop for granting debugging privileges. It hangs off of the SYS connection node in Server Explorer.
I rolled this info and most of the other content from this blog post (with many updates) into the Oracle Developer Tools for Visual Studio (ODT) online help. From Visual Studio, find the ODT help, find the "Oracle PL/SQL Debugger" section, then "PL/SQL Debugging Setup", then go through the"Debugging Setup Checklist". - CS]
We just released ODAC 10.2.0.2.20, and one of the new features included in the production version of the Oracle Developer Tools for Visual Studio .NET is a fully integrated PL/SQL Debugger that works with both Visual Studio .NET 2003 as well as Visual Studio 2005. It also supports most Oracle datatypes in the debugger including PL/SQL arrays, PL/SQL records, UDTs and so on.
Configuring it for the first time requires a few steps that are well documented in our online help (installs with ODT), but I figured I should post them here to aid those of you who want to take the PL/SQL debugger on a test drive as quickly as possible.
Step 1: Make sure the database you are going to use is version 9.2 or later.
Step 2: Using the ODT Query window or SQL*Plus, connect with SYSDBA priveleges and "grant debug any procedure to username". As an alternate to the debug any procedure privilege, you may grant both debug and execute permissions on the particular PL/SQL program being debugged.
Step 3: If you are using Oracle 10, you also need to do a "grant debug connect session to username".
Step 4: Compile the PL/SQL program units with debug information. To do this, go to the Oracle Explorer and find the node that represents the package, procedure or function that you want to debug. Right click it, and from the menu select Compile Debug. The icon next to the PL/SQL procedure or function will change to reflect the fact that it has been compiled with debug information.

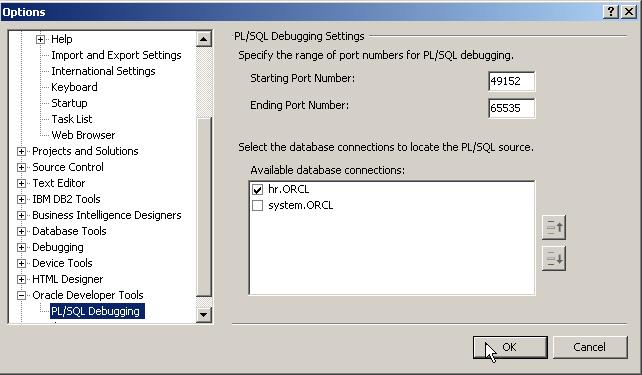
Step 5: Set the PL/SQL Debugger options: Select Tools -> Options from the Visual Studio menu. Select Oracle Developer Tools in the Options list, and then select the check box next to the connection that you are using in the Available Database Connections list. This tells the PL/SQL debugger to look for the PL/SQL code using this connection. In the same location, you will see a TCP/IP port range. During PL/SQL debugging, the Oracle Database will connect to Visual Studio via TCP/IP on a random port within this range. Make sure this range represents open ports on the machine with Visual Studio on it, and that the ports are not blocked by a firewall.
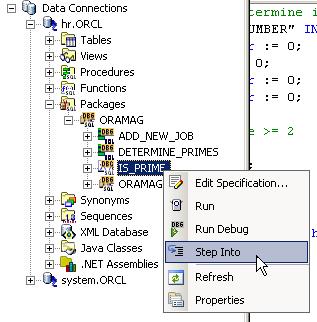
Step 6: At this point you can immediately begin debugging by right clicking on the procedure and function name in Oracle Explorer and choosing "Step into" or "Run Debug" (if a break point is set)
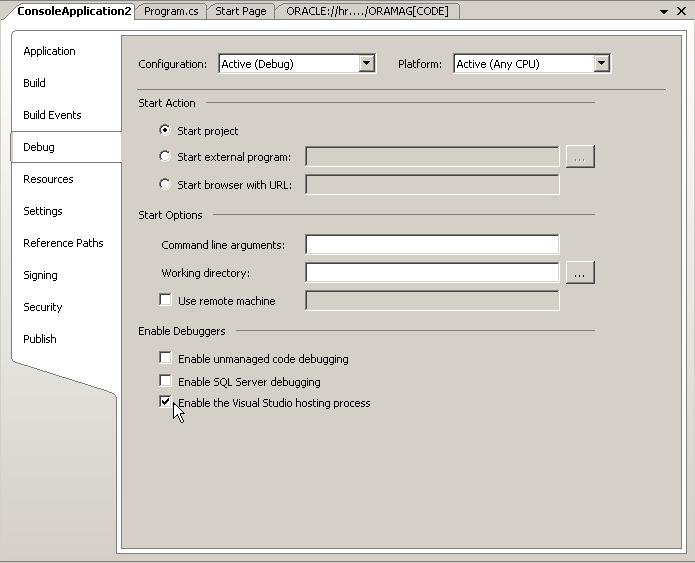
Step 7: If you want to debug .NET code that calls your PL/SQL procedure and look at the live data being passed back and forth, you have three more steps - Assuming your .NET application project is loaded, select Project -> Properties from the Visual Studio main menu, click the Debug tab, and uncheck "Enable the Visual Studio hosting process" in the Enable Debuggers list. If you don't do this, you will have to run the debugger one time and stop it before it will work correctly.
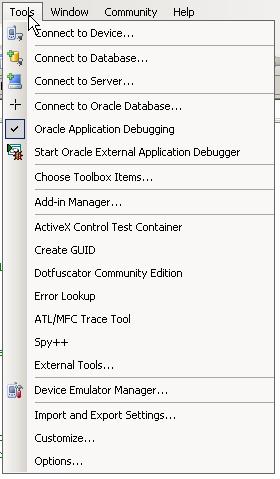
Step 8: Turn on the Application level debugger - select Tools -> Oracle Application Debugging from the Visual Studio menu, and ensure there is a check mark next to Oracle Application Debugging
Step 9: Set a breakpoint in the PL/SQL program, and you may also want to do so in your .NET application code at some line of code AFTER the call to the PL/SQL program. That will stop execution after you return from debugging the PL/SQL. Next, build and begin debugging your .NET application, and the PL/SQL breakpoint will fire. Then you can look at the live data being passed back and forth between your .NET app and the PL/SQL procedure.
More on the PL/SQL debugger in the days ahead...... happy coding!
Labels: PL/SQL Debugging
![]()